- study for math test; do book report
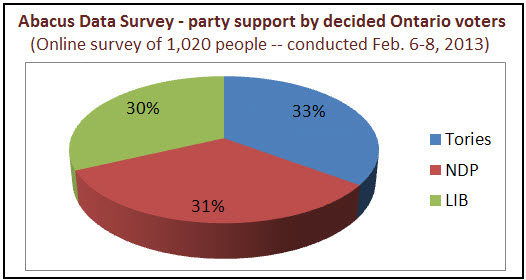
- find data for the following survey. These data can be plot in pie graphs because each adds up to 100%
case 1: June 7, 2018 election. Support for Liberal, PC and NDP
https://globalnews.ca/news/4037303/ontario-pcs-election-poll/
http://poll.forumresearch.com/post/2831/brown-enters-race-2018/
Case 2: Worst roads in Ontario
http://caaworstroads.com/sco
Case 3, Federal Government election results, 2015
http://www.cbc.ca/news2/interactives/results-2015/
Case 4, monthly expenses
http://canadianbudgetbinder.com/2014/05/05/need-review-automated-bill-payments/
Pick two sets of data, learn how to prepare pie graphs in Excel or Sheet